Quick guide to Rosetta and its graphics
About Rosetta
 One of the major goals of Rosetta is to predict the shapes that proteins fold up into in nature. Proteins are linear polymer molecules made up of amino acid monomers and are often refered to as "chains." Amino acids can be considered as the "links" in a protein "chain". Here is a simple analogy. When considering a metal chain, it can have many different shapes depending on the forces exerted upon it. For example, if you pull its ends, the chain will extend to a straight line and if you drop it on the floor, it will take on a unique shape. Unlike metal chains that are made of identical links, proteins are made of 20 different amino acids that each have their own unique properties (different shapes, and attractive and repulsive forces, for example), and in combination, the amino acids exert forces on the chain to make it take on a specific shape, which we call a "fold." The order in which the amino acids are linked determines the protein's fold. There are many kinds of proteins that vary in the number and order of their amino acids.
To predict the shape that a particular protein adopts in nature, what we are really trying to do is find the fold with the lowest energy. The energy is determined by a number of factors. For example, some amino acids are attracted to each other so when they are close in space, their interaction provides a favorable contribution to the energy. Rosetta's strategy for finding low energy shapes looks like this:
- Start with a fully unfolded chain (like a metal chain with its ends pulled).
- Move a part of the chain to create a new shape.
- Calculate the energy of the new shape.
- Accept or reject the move depending on the change in energy.
- Repeat 2 through 4 until every part of the chain has been moved a lot of times.
We call this a trajectory. The end result of a trajectory is a predicted structure. Rosetta keeps track of the lowest energy shape found in each trajectory. Each trajectory is unique, because the attempted moves are determined by a random number. They do not always find the same low energy shape because there are so many possibilities.
A trajectory may consist of two stages. The first stage uses a simplified representation of amino acids which allows us to try many different possible shapes rapidly. This stage is regarded as a low resolution search and on the screen saver you will see the protein chain jumping around a lot. In the second stage, Rosetta uses a full representation of amino acids. This stage is refered to as "relaxation." Instead of moving around a lot, the protein tries smaller changes in an attempt to move the amino acids to their correct arrangment. This stage is regarded as a high resolution search and on the screen saver, you will see the protein chain jiggle around a little. Rosetta can do the first stage in a few minutes on a modern computer. The second stage takes longer because of the increased complexity when considering the full representation (all atoms) of amino acids.
Your computer typically generates 5-20 of these trajectories (per work unit) and then sends us back the lowest energy shape seen in each one. We then look at all of the low energy shapes, generated by all of your computers, to find the very lowest ones. This becomes our prediction for the fold of that protein.
Screen Saver
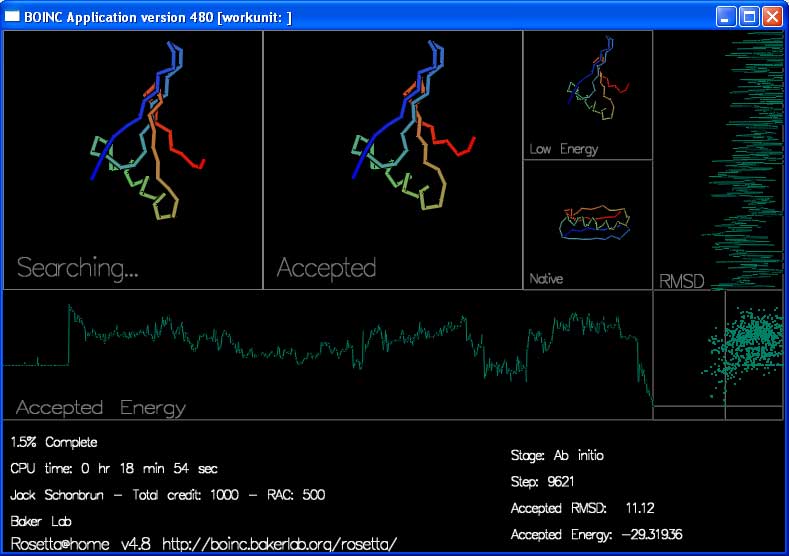
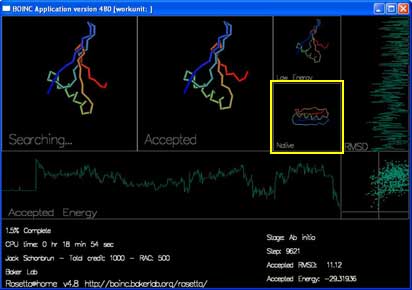
The screen saver shows the progress of each trajectory while it is happening:
There are 4 boxes showing the shape of the protein chain.
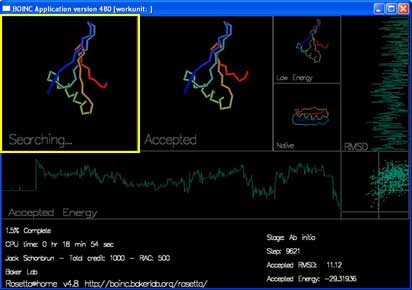
"Searching..." shows the moves that Rosetta is trying to make to the chain. You can see the shape of the chain by following the rainbow colors from blue to red.
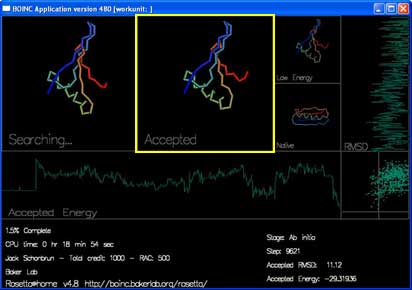
"Accepted" shows the most recently accepted move.
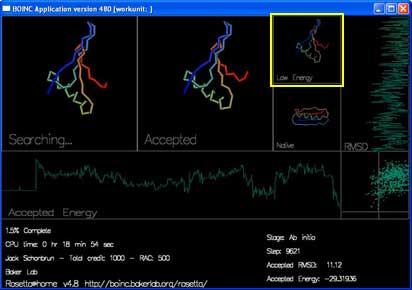
"Low Energy" shows the lowest energy shape seen in the current trajectory.
"Native" shows the experimentally determined true shape, if known.
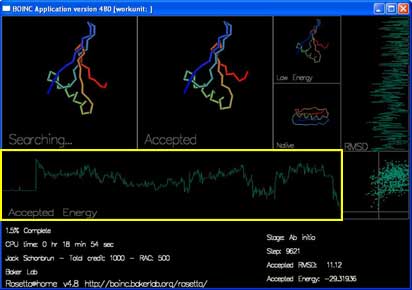
There are also two graphs and a plot that track the energy and rmsd of each accepted move.
"Accepted Energy" is a graph showing the energy of each accepted move in this trajectory. (x-axis is progress in the trajectory, y-axis is energy.)
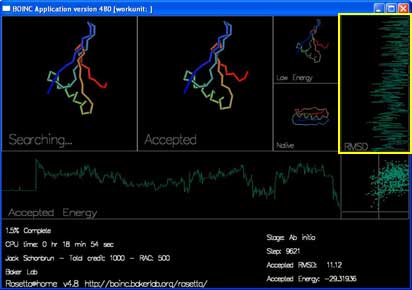
"RMSD" shows how close the currently accepted structure is to the right answer. (x-axis is RMSD, y-axis is progress.)
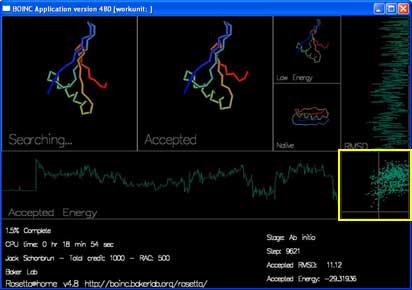
The final box, in the lower right hand corner, plots the energy and RMSD of each accepted move.
You can change the display by pressing the keys:
- 's' to change the side chain display, for example to show amino acid side chains in stick, spheres, etc.
- 'b' to change the backbone display, for example to show the backbone in cartoon, spheres, etc.
- 'c' to change the display color.

©2026 University of Washington
http://www.bakerlab.org